For July to September 2026, four of NOAA’s atmospheric indices rank first in their records. The Southern Oscillation Index (SOI), the 200-hPa wind index and the central and eastern Pacific 850-hPa wind indices each have the largest July to September value in the El Niño direction of any year from 1979 to 2025, and of 2026. The margins are large for the central 850-hPa index, the 200-hPa index and the eastern 850-hPa index, and narrow for the SOI. The western 850-hPa index and RONI rank second, and an outgoing longwave radiation (OLR) index ranks sixth.
That bears on a question we left open on 22 June. That post asked whether the atmosphere would respond as strongly as the ocean, laid out a scenario in which it stayed muted, and named the signals that would tell the scenarios apart. Through September, the pressure and wind indices do not show a muted circulation. They show the circulation at or near the top of the 1979 to 2025 range.
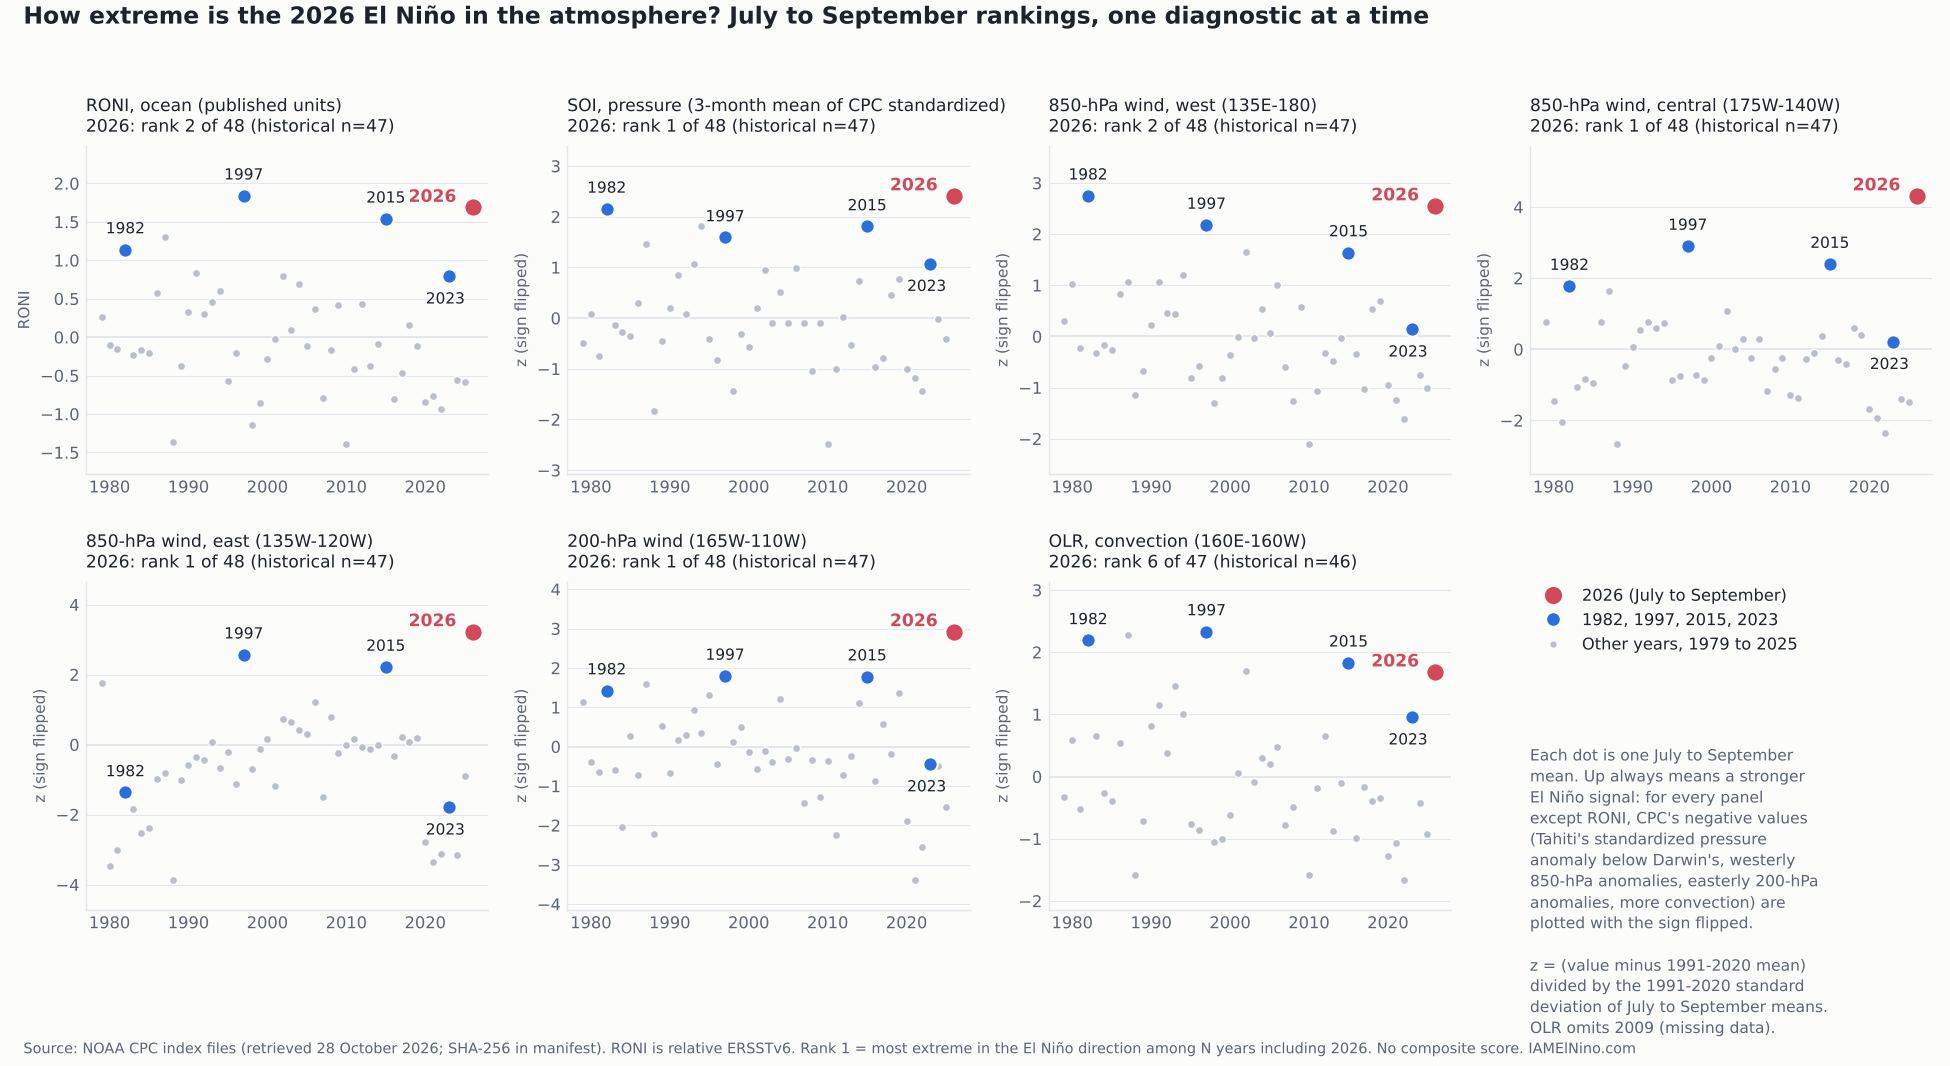
What the four first-place indices measure
They are different gauges of the same machine. Normally, high pressure over the eastern Pacific and low pressure over the Indonesian region drive easterly trade winds along the equator at the surface and westerlies aloft, with rising air and heavy rain over the western Pacific. During El Niño the pressure contrast weakens (a negative SOI, meaning Tahiti’s standardized pressure anomaly is lower than Darwin’s), the trade winds weaken (a westerly anomaly at 850 hPa), and the upper-level westerlies weaken or reverse (an easterly anomaly at 200 hPa). Those are linked pieces of one circulation change, so they tend to move together. The four first-place results are one finding seen four ways, not four independent confirmations.
| CPC series | What it measures | El Niño direction in CPC’s sign | July to September 2026 rank |
|---|---|---|---|
| SOI | Standardized Tahiti sea-level pressure minus standardized Darwin sea-level pressure | Negative: Tahiti’s standardized pressure anomaly is lower than Darwin’s | 1 of 48 |
| 200-hPa wind | Zonal wind anomaly aloft, equator, 165W to 110W | Negative: easterly anomaly | 1 of 48 |
| 850-hPa wind, central | Low-level trade wind index, 5N to 5S, 175W to 140W | Negative: westerly anomaly (weaker trades) | 1 of 48 |
| 850-hPa wind, east | Same, 135W to 120W | Negative: westerly anomaly | 1 of 48 |
| 850-hPa wind, west | Same, 135E to 180 | Negative: westerly anomaly | 2 of 48 (behind 1982) |
| RONI (ocean) | Relative Niño 3.4 index, seasonal, ERSSTv6 | Positive | 2 of 48 (behind 1997) |
| OLR | Outgoing longwave radiation, equator, 160E to 160W | Negative: more convection | 6 of 47 (2009 missing) |
Each value is the July to September mean of CPC’s monthly series. For the SOI it is the three-month mean of CPC’s official monthly standardized SOI (July -2.4, August -1.1, September -2.0, a mean of -1.83). For the wind and OLR indices it is the mean of CPC’s original monthly values, standardized against the 1991 to 2020 July to September means. The ranking is by the value in the El Niño direction, and the figure above flips the sign where CPC’s negative values mean a stronger El Niño so that up always means stronger.
Westerly anomalies, not westerly winds
The 850-hPa indices record departures from normal, not the wind itself. CPC defines negative standardized values of these indices as westerly anomalies. The trade winds normally blow from the east, so a westerly anomaly can arise from easterlies that have only weakened, without the wind reversing direction. This article therefore reports record westerly anomalies in the central and eastern boxes and does not say that the actual wind there blew from the west. The western-box index ranks second, behind 1982.
The full ranking, with margins
| Series | 2026 value | z vs 1991-2020 | Next year ahead (gap) | Next year behind (gap) |
|---|---|---|---|---|
| SOI | -1.83 | -2.41 | none | 1982 (-1.63), 0.20 |
| 200-hPa wind | -8.00 | -2.93 | none | 1997 (-5.77), 2.23 |
| 850-hPa wind, central | +1.47 | -4.32 | none | 1997 (+3.60), 2.13 |
| 850-hPa wind, east | +5.07 | -3.23 | none | 1997 (+5.63), 0.57 |
| 850-hPa wind, west | -1.60 | -2.56 | 1982 (-2.00), 0.40 | 1997 (-0.83), 0.77 |
| RONI | +1.69 | not restandardized | 1997 (+1.84), 0.15 | 2015 (+1.54), 0.15 |
| OLR | +33.30 | -1.68 | 2002 (+33.10), 0.20 | 1993 (+35.53), 2.23 |
Units are CPC’s index units, which the files do not state for the wind and OLR series, and gaps are in the same units. The SOI lead over 1982 is 0.20, or 0.26 standard deviations, and the OLR gap to 2002 is 0.20. Both gaps exceed our pre-set near-tie threshold (0.1, set by the rounding of the monthly inputs), so the orderings stand under the stated method. The margins are small, and data revisions could change close rankings. The July to September SOI also hides a noisy season, with August far weaker than July or September, which is why the seasonal value is used. CPC’s SOI file extends to 1951, and as a context check outside the preset window, 2026 also ranks first among the 76 July to September seasons from 1951 to 2026.
The sixth-place convection index
OLR in CPC’s 160E to 160W box ranks sixth of 47, behind 1997, 1987, 1982, 2015 and 2002. That is a ranking among very strong years. In 2026 the index was 1.68 standard deviations in the El Niño direction, meaning enhanced convection, and it is not evidence that convection is failing to respond. It is also one box. CPC publishes a second central Pacific OLR index over a different region, and the two convection products give different rankings. The reason is unresolved: the geography of the boxes and the data behind each product may both matter. We have not verified the second product’s definition, so we do not rank on it here, and we kept the pre-set series as primary.
Does the stage of development change the picture?
A calendar-season ranking compares each year at the same time of year, but El Niños develop on different schedules. As a sensitivity check we aligned events by age. The rule, fixed before calculation, uses RONI: an event is a run of at least five consecutive seasons at or above +0.5, and onset is the first season of the run. By that rule 2026 began with May to July 2026, so July to September is two seasons after onset. That onset is provisional: the run is still open and only three qualifying seasons (May to July, June to August and July to September) are available, short of the rule’s five-season requirement. Among the 13 qualifying events from 1979 to 2025 plus 2026, 2026 at the same age ranks first in RONI, the SOI, the central and eastern 850-hPa indices and the 200-hPa index, second in the western 850-hPa index, and fourth of 13 in OLR (the 2009 event is excluded for missing data).
| Event at the same age | Onset (RONI rule) | Season compared | RONI | SOI z | 850 W z | 850 C z | 850 E z | 200 z | OLR z |
|---|---|---|---|---|---|---|---|---|---|
| 1982 | AMJ 1982 | JJA 1982 | +0.89 | -2.26 | -2.89 | -1.17 | +2.23 | -1.03 | -1.73 |
| 1997 | AMJ 1997 | JJA 1997 | +1.50 | -1.94 | -2.36 | -3.23 | -2.20 | -2.29 | -2.26 |
| 2015 | FMA 2015 | AMJ 2015 | +0.89 | -0.83 | -1.38 | -1.58 | -0.75 | -1.57 | -1.58 |
| 2023 | JJA 2023 | ASO 2023 | +1.04 | -1.03 | -0.36 | -0.57 | +0.04 | -0.56 | -0.70 |
| 2026 | MJJ 2026 (provisional) | JAS 2026 | +1.69 | -2.41 | -2.56 | -4.32 | -3.23 | -2.93 | -1.68 |
The table keeps CPC’s signs. For the SOI, the wind columns and OLR, negative means a stronger El Niño signal, and RONI is in published units (positive means warmer). Two entries are not negative: the eastern 850-hPa index in 1982 (+2.23, an easterly anomaly) and in 2023 (+0.04, near zero). The onset dates are sensitive near the threshold. At +0.4, 2026 starts a season earlier and 2015 starts in October to December 2014; at +0.6, 2015 starts in March to May 2015. The age-matched rank of 2026 did not change except in OLR, which ranked fifth rather than fourth under two of the other three rules. This is a retrospective alignment, not an operational onset declaration.
What this does not show
It does not show that 2026 is the strongest El Niño on record: RONI ranks second for the season, and the first-place results are in specific series over 1979 to 2025. It does not show a ranking for the whole atmosphere, because we calculated no composite and the indices are not independent. It does not show how the atmosphere responds relative to the amount of ocean warming, which would need a historical relationship and an uncertainty estimate that CPC does not publish for these indices. It does not describe winter weather or any regional impact. And the values are CPC’s as retrieved on 28 October, with September the newest month, so they may be revised. CPC’s wind indices are described in its README as derived from the NCEP/NCAR reanalysis, and the files give no version or record-change notes, so we do not claim the series is homogeneous across 1979 to 2026.
The June question
The 22 June post gave two scenarios for winter. In the first, the atmosphere followed the record-strength oceanic forecasts. In the second, RONI-based analogs were more representative and the atmospheric response stayed muted. It named the SOI and sustained westerly wind anomalies as the tests, and the follow-up on 20 July used the Australian Troup SOI, a different scale from the NOAA CPC SOI used here. By the measures above, the muted-circulation scenario is not what these pressure and wind indices show through September. That statement is about the circulation indices, and it leaves open how the winter pattern will unfold, which depends on more than the strength of the tropical circulation. We have added an update note to the June post and left its original text unchanged.
How to check this
The package linked below contains the eleven unmodified CPC files, the retrieval manifest with source URLs, retrieval times and SHA-256 checksums, the code, the per-year table of every value and rank, and the methods file written before the rankings were run. The methods file’s SHA-256 shows the file has not changed, not when it was written. The rankings and seasonal z-scores were independently reproduced using a separate calculation with AI assistance.
Our reading. Through September, the pressure and wind indices show a strong atmospheric response, in several indices at the top of the 1979 to 2025 range. That is a July to September result in specific series, backed by one circulation change measured four ways. The convection index is in the El Niño direction and ranks sixth, which we report and do not over-read. The August to October update will show whether each record-setting diagnostic remains first.
Sources
- NOAA CPC, Current Monthly Atmospheric and Sea Surface Temperatures Index Values (files retrieved 28 October 2026)
https://www.cpc.ncep.noaa.gov/data/indices/index.shtml - NOAA CPC, index README (SOI calculation, reanalysis source, file formats)
https://www.cpc.ncep.noaa.gov/data/indices/Readme.index.shtml - NOAA CPC, Table of Atmospheric Indices (September 2026 standardized values)
https://www.cpc.ncep.noaa.gov/products/CDB/Tropics/table1.shtml - NOAA CPC, seasonal RONI file (relative index, ERSSTv6, 1991 to 2020 base)
https://www.cpc.ncep.noaa.gov/data/indices/RONI.ascii.txt - ECMWF science blog, 10 June 2026, Measuring the strength of El Niño: introducing Relative Niño indices (Tim Stockdale)
https://www.ecmwf.int/en/about/media-centre/science-blog/2026/measuring-strength-el-nino - Cai et al., Definition of Extreme El Niño and Its Impact on Projected Increase in Extreme El Niño Frequency, Geophysical Research Letters (2017) (cited for its December to February rainfall definition of extreme events; not applied here)
https://doi.org/10.1002/2017GL075635 - IAMElNino.com, The Ocean vs. The Atmosphere: Why 2026’s El Niño Could Surprise You Either Way (22 June 2026)
- IAMElNino.com, The Atmosphere Is Answering: Reading El Niño’s Deepening Southern Oscillation Index (20 July 2026)
- IAMElNino.com, reproducibility package: raw CPC files, retrieval manifest, code, per-year table, methods